Follow these step-by-step instructions to modify project settings.
Smartsheet provides essential tools for effective project management to empower your teams to execute together with speed and accountability and reach successful outcomes faster.
Gantt View: Modify project settings
The Resource Management section is only available with Business or Enterprise plans.
While using Gantt View, you can access Project Settings to modify the dependencies and the timescale of the Gantt chart. If you are in a Business or Enterprise plan, you can also modify the Resource Management features available.
You can access the Project Settings from the Grid View or the Gantt View:
- From the Gantt View: Right-click any column header in the Gantt chart and select Project Settings.
- From the Grid View: Right-click any column header in the sheet and select Edit Project Settings.
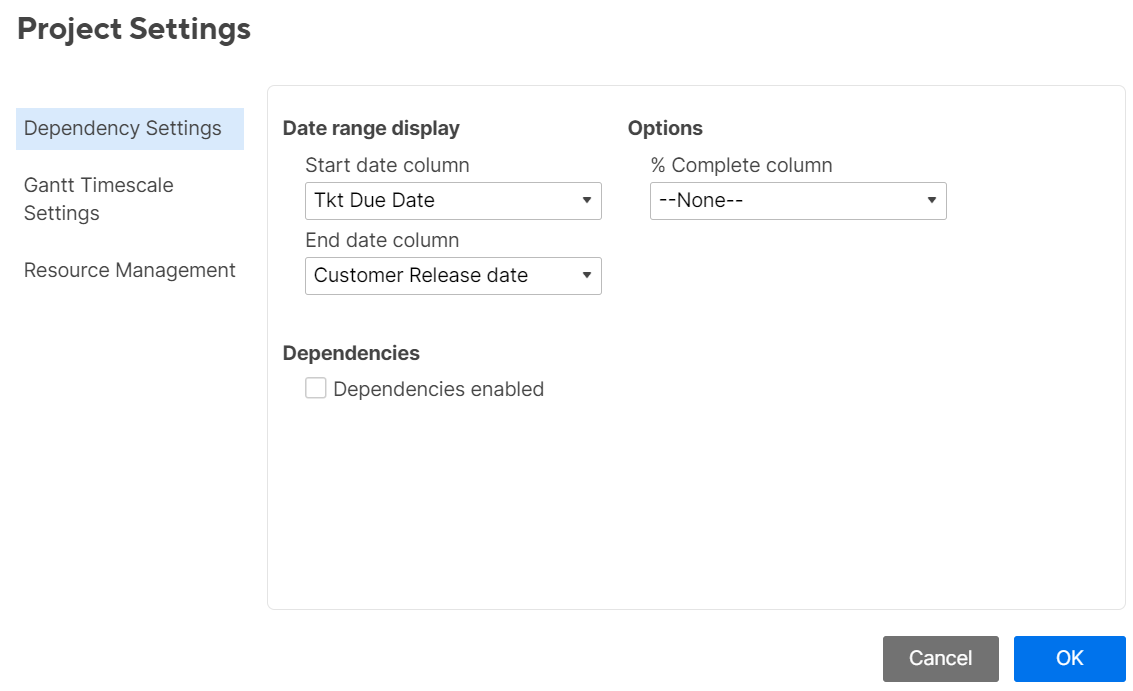
You only see the Gantt Timescale settings after switching your sheet to Gantt View.
Edit dependency settings
Date range display
Start Date and End Date columns: Select which columns to use for tracking the start date and end date.
Each scheduled task requires a start date and end date with month, day, and year. Use the date-picker icon to ensure that the date is in the correct format.
When setting up Start Date and End Date columns
- To see where the timeline differs from your original schedule, right-click any cell and select View History to see previous date values saved.
- The start and end dates are calculated automatically in rows with a given Duration and Predecessor.
- To calculate the end date, the system automatically adds the given duration to the start date.
- If a predecessor drives a task's start or end date, you can change it manually by clicking the cell and selecting a new date. Doing so overrides the association with the predecessor and removes the value from the row.
- If a parent row has a predecessor value listed, this dependency relationship drives the start dates for each child row. Removing the predecessor value on the parent row makes child rows editable for you to change dates manually.
Options
% Complete Column: Select the column that you want to assign as your % Complete column. This column overlays a % complete indicator within the task bars in the Gantt chart, allowing you to see automated % complete calculations.
In parent rows, Smartsheet automatically calculates the % complete based on both the duration and % complete values of the child rows.
To format values in this column as percentages, select the column header at the top, then select the % icon in the left toolbar.
The % Complete automation in parent rows is optional. Open the Project Settings and set the % Complete column drop-down list to None to deactivate automation. You can use formulas in the parent rows or set the parent row values manually to remove the progress indicator from the Gantt bars.
Dependencies
Activating dependencies automatically calculates and adjusts the dates as values for Duration and Predecessors change.
Once you activate dependencies, you need to assign your Predecessor and Duration columns.
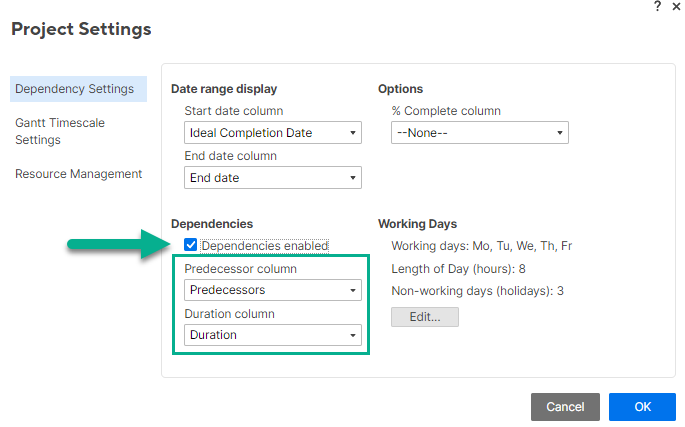
If your sheet doesn’t have existing predecessor or duration columns, Smartsheet automatically creates them for you.
Predecessor: This column is used to create dependencies between tasks in the schedule.
Duration: This column is used to automate the scheduling of a task's start and end dates.
Working days: Edit your working days and hours. You can exclude specific dates, such as holidays. By default, Smartsheet considers each working day to include 8 hours. The system considers the length of each working day when calculating dates of tasks.
With dependencies active, the start and end dates of subtasks dependent on a predecessor aren’t editable from a report, a row update request, or any of the mobile apps. You can manually update the Start Date or Duration of a task to automatically update the End Date for you.
See Activate Dependencies and use Predecessors for more details. Working days
Edit Gantt timescale settings
Edit the Gantt timeline intervals and display formatting: start of the fiscal year, and what column information appears to the right of the Gantt bars in the chart. For example, set a Contact List column as the display label to see a list of the people assigned to tasks next to each Gantt bar.
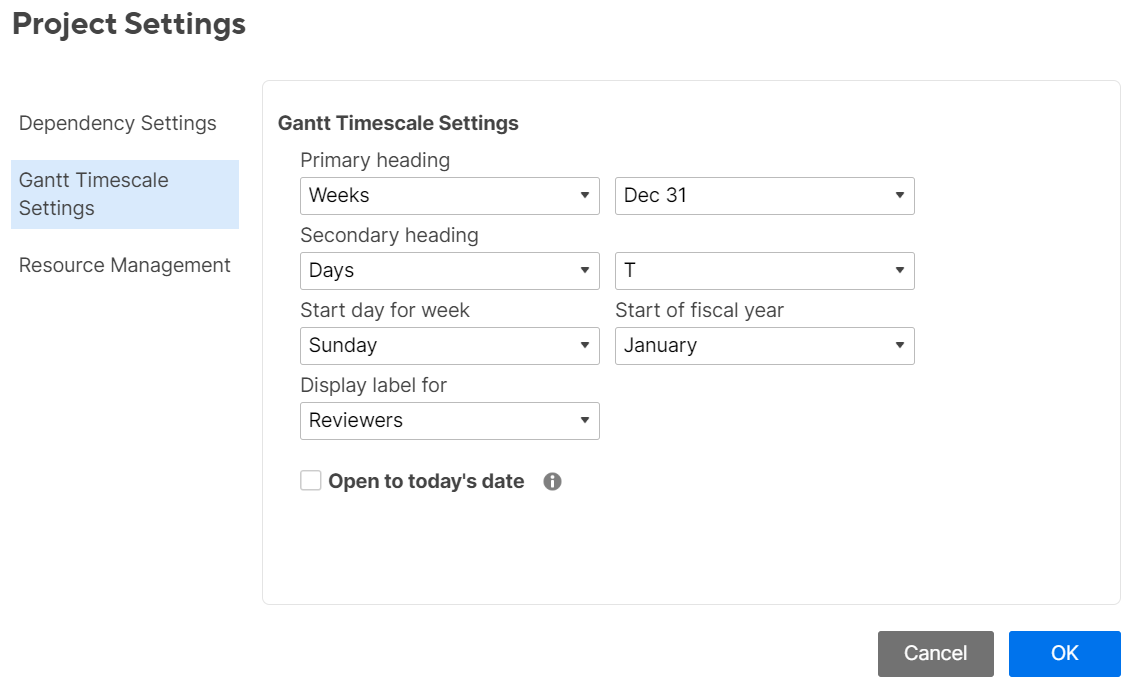
Checking the box for Open to today's date displays your current tasks in the project more quickly when you open the sheet.
The Open to today's date setting is only available to the sheet's Owner and Admins. It is unchecked by default, and it doesn’t transfer to any copies of the sheet.
Also, the view is only applied as your preference and doesn’t affect how other collaborators view the sheet.
If somebody with Editor or Viewer permissions needs to open the Gantt chart to today's date, you can create a report from your sheet in Gantt View and share them to the report.
Resource Management settings
Learn more about the Resource Management project settings.
Follow these step-by-step instructions to create milestones in your project sheet.
Create a milestone to mark a significant event in your project
A milestones is represented by a grey diamond image in the Gantt chart, centered on the provided start time.
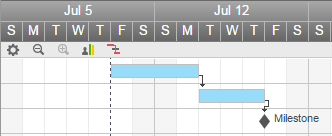
To create a milestone:
- To change your view or to add a Gantt chart to your sheet, click Grid View > Gantt View.
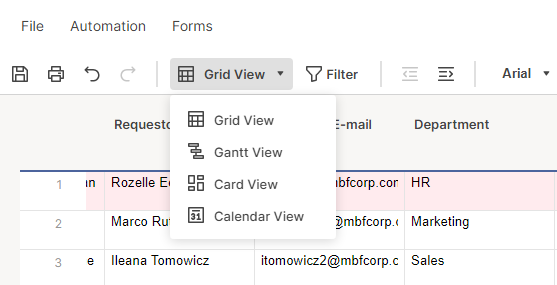
- Enable dependencies on your sheet (click Edit Project Settings in the top right corner of the Gantt chart and check the Dependencies Enabled checkbox).
- To create the milestone, enter a task duration of zero and a start date.
To create an extended milestone, enter a task duration of ~0 and a start date. An extended milestone requires one full working day to complete, but you can still see its diamond shape in the Gantt chart.
Parent rollup functionality is not compatible with milestones. You cannot % Complete rollups in tasks containing sub-tasks with milestones with a duration of zero (0).
Follow these step-by-step instructions to setup your parent rollup functionality in a project sheet.
Parent rollup functionality
Start Date, End Date, Duration, and % Complete for parent rows
The Start Date for a parent is determined by the earliest start date among all of its child rows. Similarly, the End Date is determined by the last end date among all its child rows.
The Duration on the parent indicates the number of working days between the Start Date and End Date in that row.It provides a full time span from the earliest subtask to the latest, rather than simply totaling their durations.
The % Complete on the parent row calculates a weighted percentage based on both the Duration and % Complete entered on each child row. In this way, completing child rows with shorter durations does not affect the parent row % Complete as much as completing a longer duration child row.
The parent row rollup includes only subtasks with a given Duration and a % Complete value.
Parent rollup functionality tips
- You can't edit parent rows with enabled dependencies in the Start Date, End Date, Duration, and % Complete columns. You can use your calculations if you disable the dependency functionality on the sheet or create a custom formula in a column not used in the dependency functionality.
- You can't use custom formulas to change the display or bars in the Gantt chart.
- Parent rows in dependency-enabled sheets always have a grey background in the Gantt and Calendar views.
- Parent rows always reflect duration in partial working days, even if you use other formats to show duration for the child rows.
- Parent rows don't calculate % Complete rollups when their child rows contain milestones (duration = 0).
Learn more about dependencies, hierarchies, and other parent row-related topics in the Related content articles.
